Sidebar
Step 8 - Creation and personalization of the phasing book


We are now at the “final” stage. The data is in Phase Manager, all you have to do is extract the deliverables of your choice, to analyze your project and check its feasibility or to satisfy a third party's request..
You will create a phasing book. To do this, go to the button ![]() on the left side panel. Open the “Phasing Books” menu, click on “add” and create a book called “My Book”.
on the left side panel. Open the “Phasing Books” menu, click on “add” and create a book called “My Book”.
- 1) …. Choose the sub-project
- 2) …. Tick the summary activities corresponding to the phases of your project
- 2.1) …. Tick the “Every” option to chose a specific gap parameter for your phase
- 2.2) …. Chose the value of your gap and its unity (for example : every 2 calendar days)
- 3) …. Choose a drawing
- 4) …. If necessary, replace the drawing used on each page

- 5) click on “New notebook”
Adjust labels
As the deliverable is created, it is essential to customize it. Let's start by handling the labels.
The labels can of course be adjusted manually, but it is also possible to adjust them automatically. To do this, go to the top tab “Page”. You can adjust the size of your labels using the “Annotations zoom” button, then optimize the position of your labels using the “Optimize annotations positions” button.
On the next window, click on “start”:

When the best placement is found by Phase Manager, the graph turns green, you can then stop the calculation and close the window:

The positioning of the labels has been optimized for all the pages of your phasing book.

On most of the pages of your deliverable, you will find that many areas have the same color. The reason is simple, when there are several tasks of different professions on the same area during the same phase, the conflict color is used, which you can set in the labels (see Formatting table).
Add a timescale
In a phasing book it is useful to find out where you stand in time. That's what the timescale is for.
Go to the “Page” tab and drag the Time scale object onto the board of your first phase.
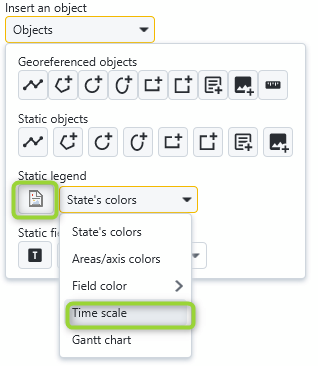
From the “Page” tab of the top panel of deliverables, it is possible to drag and drop objects such as areas legends, status legends or time scales on the boards.
To add a time scale, you have to drag and drop the button on the page of a deliverable.
The time scale being added, it is possible to resize it with the sliders of the object:

By default, the period of the board is highlighted in red and the period of the entire time scale corresponds to the period of your complete deliverable.
To change the color of the highlighted period, you can right-click on the highlighted area and go to Settings:


To customize the display of months/weeks/days, right-click in the right border in front of the one of the lines, then go to “Add line” then “Week” for example:

By repeating the operation, it is possible to obtain the following result:

It is possible to synchronize the time scale on all other boards, using the button ![]() located to the left of the frieze when it is selected.
located to the left of the frieze when it is selected.
Integrate your Gantt
In a phasing book it is useful to visualize the sequences between tasks in a same phase. For this reason, the Gantt is precious.
Go to the “Page” tab and drag the Gantt chart object onto the board of your first phase.
Automatically, the Gantt will filter the tasks concerned by the board, and zoom in on the period of the board.
From the “Page” tab of the top panel of deliverables, it is possible to drag and drop a Gantt chart onto the boards to better visualize the sequences between tasks.
Once the Gantt chart has been dragged, it is possible to customize it, by grouping or sorting tasks for example, adding frames, timelines…
To group tasks, double-click on the Gantt chart, then right-click in the header of the columns then click on Color definition for each level :

In the window that appears, select the desired successive group levels, then click on OK. For example, here we choose to group the tasks by Area. To better highlight the grouping levels it's also possible to add color to each level:

Multi-criteria sorting can be applied to as many columns as desired, simply by clicking on the column headers. For example, below, we clicked once on “Start (PM)” and sorted by increasing start dates:

The order (ascending or descending) of the sorting is marked by the direction of the black arrow. If you click a second time on “Start (PM)”, you will notice that the task furthest from the project is in first position, and that the arrow has changed direction (one more click on the header would have removed the filter):

It can also be seen that the decreasing order of the start dates has logically impacted the order of the phases. To maintain the increasing ordered grouping of phases, it will be necessary to apply two successive sortings:
- click on the column header “Phase (PM)” once
- and for example decide that the second sort criterion will be by decreasing end date, by double-clicking on “End (PM)”:

The number of arrows indicates the level of the sort criterion (here it is first by Phase, then by End date). Note that it is possible to position as many criteria as necessary.
To add a column, Right-click on a header > Add column : after selecting the field to display, the new column will be inserted to the right of the column on which you clicked. To delete a column, simply right-click > Delete column on the column to be removed. Finally, to move a column: a simple drag and drop on its header allows you to change its position.
The addition of a timeline is done by right-clicking on the timeline that will be located above the inserted line. Below we insert the week numbers under the months:

The display of the grids is done by right-clicking on the timeline of your choice and clicking on “Show/Hide grids”.
Customizing the display of a grid is also done by right-clicking on the timeline of your choice and going to “Properties”.
Your phasing booklis finished, as is almost this tutorial !
You can now print your phasing book by clicking on the button 4e603ab01284ab02fbcfc5f7634aa20a.pngand following the instructions found here in the documentation.